📊 Accepted at COLM 2025

BigCharts-R1: Enhanced Chart Reasoning with Visual Reinforcement Finetuning

â–¶ ServiceNow Research 1 â–¶ Mila - Quebec AI Institute 2 â–¶ Canada CIFAR AI Chair 3 â–¶ ETS, Montreal, Canada 4 â–¶ ServiceNow 5 â–¶ York University, Toronto, Canada 6

Abstract

BigCharts-R1 Pipeline
Figure 1: BigCharts construction and BigCharts-R1 training pipeline. We begin by extracting a high-quality corpus from open chart datasets, Google Search, and Common Crawl. We then generate and execute the code responsible for producing these charts to replot them, and then derive question-answer pairs with chain-of-thought reasoning. For training BigCharts-R1, we use a two-stage approach: (i) visual instruction tuning via SFT on large-scale synthetic data, and (b) RL (GRPO) with verifiable rewards and human-labeled data to enhance chart reasoning.

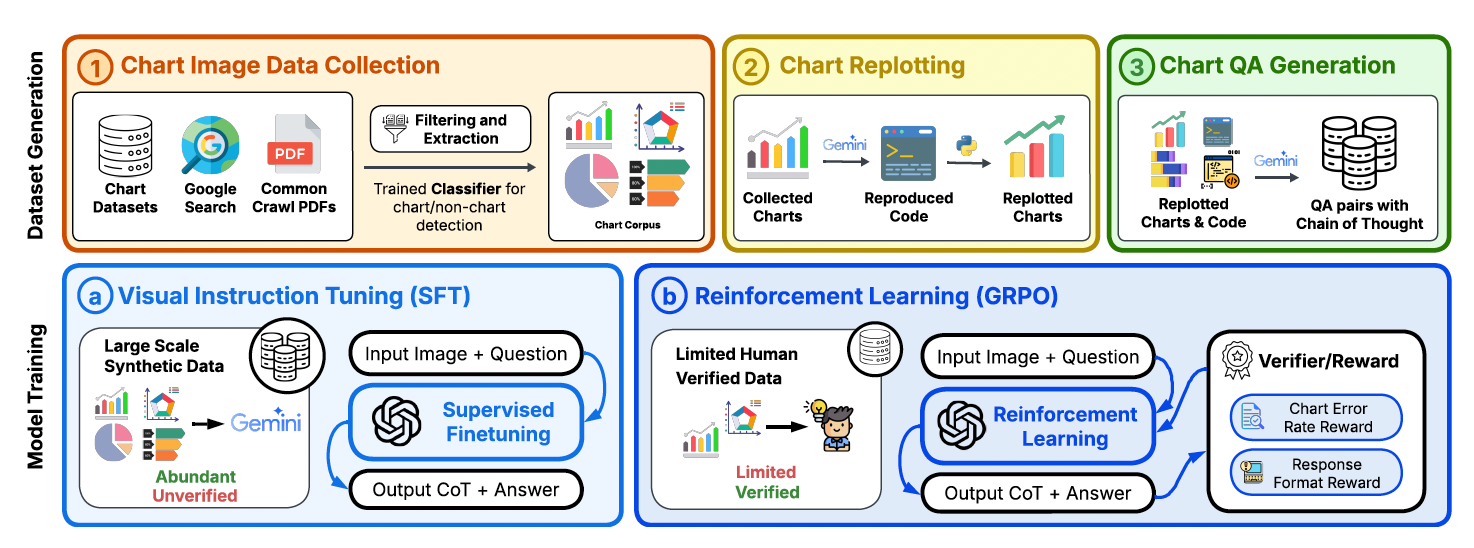
Chart comprehension is crucial for effective human decision-making, yet current vision-language models (VLMs) struggle with this task due to limitations in training data and methodologies. To address these challenges, we introduce BigCharts-R1, a state-of-the-art chart reasoning model, alongside a novel dataset and training framework.

  1. BigCharts Dataset. We propose a novel dataset creation pipeline, BigCharts, which generates visually diverse chart images by replotting real-world charts sourced from various online platforms. Unlike purely synthetic datasets, BigCharts maintains authenticity and visual diversity while ensuring accurate underlying data, overcoming the estimation errors often found in automatically extracted data tables.
  2. Comprehensive Training Framework:. Our approach integrates supervised fine-tuning (SFT) with Group Relative Policy Optimization (GRPO)-based reinforcement learning. We introduce novel reward signals specifically designed for chart reasoning, which significantly enhances model robustness and generalization across diverse chart styles and domains.
  3. State-of-the-Art Performance:. Extensive experiments demonstrate that BigCharts-R1 surpasses existing methods on multiple chart question-answering benchmarks, outperforming even larger open-source and closed-source models. This showcases BigCharts-R1's superior capabilities in chart reasoning.
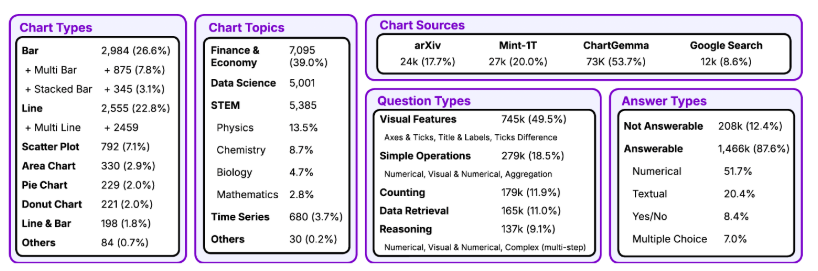
Dataset Statistics

BigCharts Dataset Statistics
Figure 2: Figure 2 provides statistics of the BIGCHARTS dataset, presenting the distribution of chart sources, chart topics, and chart question and answer types.

Results

We evaluate BigCharts-R1 against state-of-the-art open-source and closed-source models across multiple chart question answering benchmarks. Our models demonstrate superior performance, particularly in the 3B and 7B parameter ranges.

Comparison of BigCharts-R1 and variants with open-source and closed-source baselines on chart question answering benchmarks

Model
FQA-Sub
Val1
FQA-Sub
Val2
DVQA-Sub
ValE
DVQA-Sub
ValH
PQA-Sub
T1
PQA-Sub
T2
ChartQA
aug
ChartQA
hum
ChartQA
avg
CharXiv
Reas.
CharXiv
Des.
Avg
Closed-Source Models
GPT-4o (OpenAI et al., 2024)
65.70
69.10
57.50
61.20
59.50
19.90
-
-
85.07
50.50
82.58
61.22
Gemini-Flash-2.0 (Georgiev et al., 2024)
54.90
54.50
60.60
59.50
60.40
32.70
-
-
85.40
50.30
75.10
59.26
Claude Sonnet 3.5 (Anthropic, 2024)
43.30
44.70
56.90
56.60
49.20
32.90
-
-
90.80
60.20
84.30
57.65
Open-Source Models < 7B
Intern-VL2.5-1B (Chen et al., 2025)
59.4
60.0
93.2
92.2
61.70
24.80
-
-
75.9
19.00
38.40
58.29
Intern-VL2.5-2B (Chen et al., 2025)
64.3
64.3
97.5
95.7
71.10
38.20
-
-
79.2
21.30
49.70
64.59
Phi 3.5-Vision-4B (Abdin et al., 2024)
64.9
66.8
84.9
84.1
48.6
11.90
-
-
81.8
32.70
55.02
58.97
Open-Source Models 7-12B
Intern-VL2.5-8B (Chen et al., 2025)
69.60
69.00
96.60
95.20
74.70
42.30
-
-
84.80
32.90
68.60
70.41
LLaVA-Next-Mistral-7B (Li et al., 2024a)
58.1
57.7
72.1
71.2
41.7
8.0
-
-
51.80
13.90
35.40
45.54
Llama 3.2-Vision-11B (Grattafiori et al., 2024)
0.0
0.0
3.5
3.2
0.0
0.0
-
-
83.40
31.20
59.35
20.07
Chart-Specific LVLMs
ChartGemma-3B (Masry et al., 2024b)
38.90
37.00
37.90
37.00
35.60
20.70
90.80
69.52
80.16
12.50
21.30
35.67
TinyChart-3B (Zhang et al., 2024)
48.00
46.10
61.90
50.20
55.30
50.60
93.86
73.34
83.60
8.30
16.15
46.68
Our Qwen2.5-VL Models
Qwen2.5-VL-3B (CoT)
58.10
57.00
76.20
75.60
54.80
43.30
86.40
63.84
75.12
32.60
59.77
59.17
Qwen2.5-VL-3B + SFT
76.10
75.70
76.30
73.80
74.60
58.40
90.00
79.20
84.60
36.00
62.85
68.71
BigCharts-R1-3B
80.10
81.00
81.20
80.60
78.50
59.90
94.32
82.00
88.16
37.40
62.38
72.14
Qwen2.5-VL-7B (CoT)
80.70
79.30
78.30
78.30
73.40
50.40
81.68
71.28
76.48
41.30
66.85
69.45
Qwen2.5-VL-7B + SFT
79.10
75.90
79.80
77.50
77.70
60.40
91.44
80.88
86.16
39.40
69.00
71.66
BigCharts-R1-7B
81.20
81.20
83.80
83.60
80.90
61.90
94.88
84.80
89.84
41.30
66.58
74.48
Key Results:

BigCharts-R1-3B achieves an average score of 72.14% across all benchmarks, outperforming GPT-4o (61.22%) by a significant margin.

BigCharts-R1-7B reaches 74.48% average performance, demonstrating the effectiveness of our training approach at larger scales.

Our models show particularly strong performance on chart-specific tasks like ChartQA and DVQA, highlighting the benefits of our specialized training methodology.

🔜[Coming Soon!] More details about methodology, evaluation metrics, code, and dataset.